Year 3 individual project · Advanced AI Methods and Tools
Does prompt wording change what CLIP finds?
An experiment on a frozen vision-language model: I worded the same ten queries four ways, including deliberately misleading ones, and measured what changed. Overall accuracy barely moved (86.2–87.5%), individual classes did, and my retrieval metric turned out too easy to show anything.
- Context
- Individual project, Year 3 · Advanced AI Methods and Tools, University of Bradford
- My role
- Sole author: experiment design, code, evaluation, demo and report
- Team
- Individual
- Dates
- Semester 1, 2025–26 · submitted December 2025
- Status
- Completed academic study · notebook on GitHub
Stack
- Python
- PyTorch
- Hugging Face Transformers
- CLIP ViT-B/32
- scikit-learn
- Gradio
- Google Colab (CPU)
The short version
Each point is expanded, with diagrams, in the sections below.
- 01Problem and constraints
- Does the wording of a text prompt change which images CLIP matches it with? And how does zero-shot CLIP compare with a small classifier trained on its features?
- 02My responsibility
- Individual work: I chose the prompt conditions, wrote the evaluation, built a demo and wrote the report.
- 03The design
- One frozen CLIP model on CPU, a fixed 1,000-image CIFAR-10 gallery (seed 0), four prompt conditions, and a linear probe on the same image embeddings.
- 04What I implemented
- Embedding and ranking code, four prompt sets, retrieval and classification metrics, confusion matrices, a linear probe and a four-tool Gradio demo.
- 05The team’s part
- None: individual coursework.
- 06What was delivered
- A notebook with its stored outputs (now public on GitHub), a report, a recorded walkthrough and a demo run from Colab.
- 07What testing established
- Classifying the 1,000 gallery images, the four wordings scored between 86.2% and 87.5%. On the same 200 held-out images, a linear probe reached 91.5% against zero-shot's 87.0%.
- 08Learned, and unfinished
- Pick a metric that can move: my retrieval check scored a perfect 1.0 in every condition. And look below the total, where the trade-offs between classes were.
On this page
The question
CLIP matches images and text by embedding both in the same space, so a text query can find images it was never trained to label. That makes the wording of the query part of the model. I wanted to measure how much it mattered.
I kept everything else fixed: the model, the images and the random seed. Only the prompts changed. Alongside the single canonical prompt, I wrote three sets of five templates: natural rewordings, deliberately misleading descriptions and descriptions of poor image quality. A set's five prompts are averaged into one query per class.
| Condition | Templates | What it tests |
|---|---|---|
| Canonical | a photo of a {label} | The standard single prompt: the baseline |
| Ensemble A: natural | a photo of / a picture of / an image of / a close-up photo of / a bright photo of a {label} | Everyday rewordings |
| Ensemble B: misleading | a random object unrelated to a {label} · an incorrect depiction of a {label} · a distorted sculpture not resembling a {label} · a photo of something different instead of a {label} · an abstract wrong representation of a {label} | Wording that contradicts the image |
| Ensemble C: degraded | a blurry photo of a {label} · a low resolution image of a {label} · a {label} partially hidden behind objects · an overexposed photo of a {label} · a small {label} in the distance | Descriptions of poor image quality |
The set-up
The images are encoded once and reused for every condition, so any difference comes from the text side. Each image is compared with each class query by cosine similarity. The same scores support two measurements: retrieving images for a class name, and classifying each image by its most similar class.
One frozen model, one fixed gallery, four ways of wording the query
- Implemented
- External service or data
- Decision
- Stored data
- Incomplete, or a gap found in testing
Text version of this diagram
Parts
- Images: encoded once
- CIFAR-10 test split — 10,000 images, 32 × 32 pixels
- Fixed gallery — 100 images per class, seed 0: 1,000 images
- CLIP image encoder — ViT-B/32, frozen, on CPU; upscaled to 224 × 224
- Image embeddings — 1,000 × 512, unit length
- Text: once per condition
- Ten class names — airplane, automobile … truck
- Four prompt conditions — canonical: 1 template; A, B and C: 5 templates each
- CLIP text encoder — an ensemble's templates are averaged per class
- Class embeddings — 10 × 512 for each condition
- Evaluation
- Cosine similarity — dot product of unit vectors, then rank
- Zero-shot classification — each image takes its most similar class: accuracy, F1, confusion
- Retrieval check (Recall@1, @5) — 10 class-name queries: is a correct image in the top K?; incomplete or failed in testing
- Linear probe — logistic regression on the same embeddings: 800 train, 200 test
Connections
- CIFAR-10 test split → Fixed gallery
- Fixed gallery → CLIP image encoder
- CLIP image encoder → Image embeddings
- Ten class names → Four prompt conditions
- Four prompt conditions → CLIP text encoder
- CLIP text encoder → Class embeddings
- Image embeddings → Cosine similarity
- Class embeddings → Cosine similarity
- Cosine similarity → Zero-shot classification
- Cosine similarity → Retrieval check (Recall@1, @5)
- Image embeddings → Linear probe
What the numbers showed
My main retrieval metric, Recall@1 and Recall@5, was 1.0 for every condition. It asked whether each of the ten class-name queries put a correct image first (Recall@1) or anywhere in the top five (Recall@5), and every query did, however it was worded. A metric that cannot fall cannot compare anything, so the useful evidence came from classifying all 1,000 gallery images instead.
Four wordings, almost the same accuracy
| Prompt condition | Accuracy |
|---|---|
| 87.2% · 872 | |
| 87.1% · 871 | |
| 87.5% · 875 | |
| 86.2% · 862 |
The misleading prompts came out highest, by three images out of 1,000, and the degraded ones lowest, ten images below the baseline. Differences that small are too close to rank. What did change was the pattern underneath.
Totals barely move; individual classes do
| Class | Canonical | Ensemble A: natural | Ensemble B: misleading | Ensemble C: degraded |
|---|---|---|---|---|
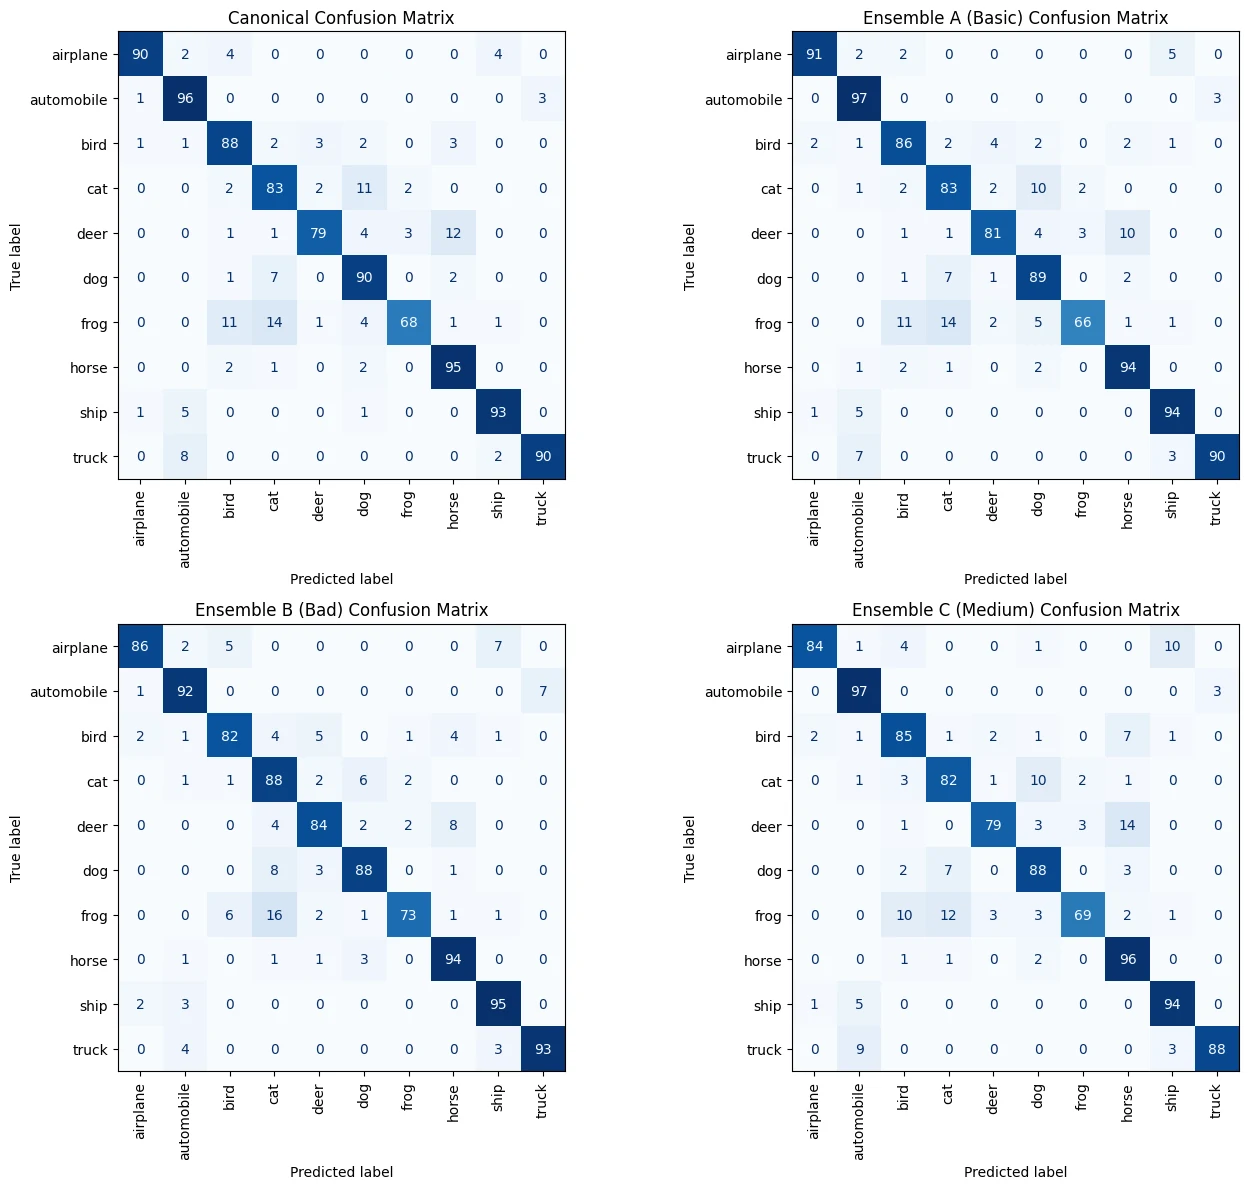
| frog | 68 | 66 −2 fewer than canonical | 73 +5 more than canonical | 69 +1 more than canonical |
| deer | 79 | 81 +2 more than canonical | 84 +5 more than canonical | 79 ±0 |
| cat | 83 | 83 ±0 | 88 +5 more than canonical | 82 −1 fewer than canonical |
| bird | 88 | 86 −2 fewer than canonical | 82 −6 fewer than canonical | 85 −3 fewer than canonical |
| airplane | 90 | 91 +1 more than canonical | 86 −4 fewer than canonical | 84 −6 fewer than canonical |
| dog | 90 | 89 −1 fewer than canonical | 88 −2 fewer than canonical | 88 −2 fewer than canonical |
| truck | 90 | 90 ±0 | 93 +3 more than canonical | 88 −2 fewer than canonical |
| ship | 93 | 94 +1 more than canonical | 95 +2 more than canonical | 94 +1 more than canonical |
| horse | 95 | 94 −1 fewer than canonical | 94 −1 fewer than canonical | 96 +1 more than canonical |
| automobile | 96 | 97 +1 more than canonical | 92 −4 fewer than canonical | 97 +1 more than canonical |
| All 1,000 | 872 | 871 −1 fewer than canonical | 875 +3 more than canonical | 862 −10 fewer than canonical |
- more correct than canonical
- fewer correct than canonical
The misleading prompts (B) gained on frog, deer and cat but lost on airplane, bird and automobile, so their total ended up close to the others. The images are the same in every column, so the wording caused these changes; but they are counts from one sample of 100 images per class, and a change of a few images may not hold on a different sample.
- What I expectedAveraging several prompts beats one
- What the stored results showNot supported: the three ensembles landed 3 images above to 10 below the single prompt.
- What I expectedNatural wording (A) does best
- What the stored results showNot supported: A finished level with the baseline, one image behind.
- What I expectedMisleading wording (B) does worst
- What the stored results showNot supported: B finished highest, though only by three images. Every B template still contains the class name, which may be why; that was not tested.
- What I expectedSome classes are harder than others
- What the stored results showSupported: frog was the weakest class under every wording, and cat–dog and deer–horse confusions appeared under all four.
- What I expectedZero-shot comes close to a trained probe
- What the stored results showPartly: 87.0% against 91.5% on the same 200 images, without any labelled training data.
Looking at what came back
The notebook stores the top five images for every class under each ensemble: 150 images in all. 147 are the right class. The three misses are cats returned for “dog” under the misleading prompts, and a dog returned for “cat” under the degraded ones.
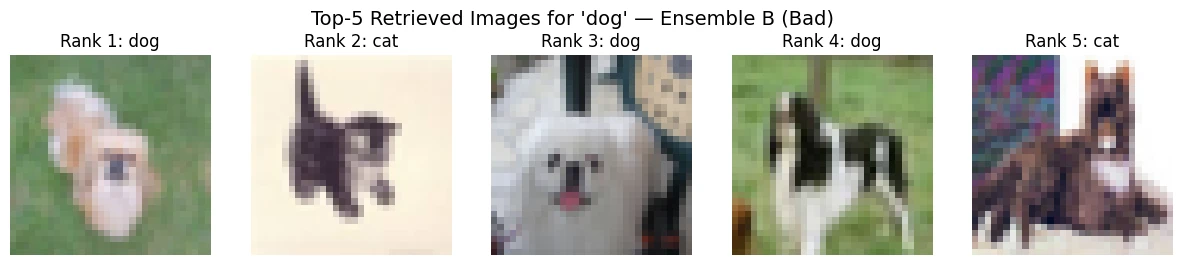
The same cat–dog and deer–horse confusions appear under every wording, which points at the image side rather than the prompts: at 32 × 32 pixels, small animals are hard to tell apart.
Zero-shot against a trained probe
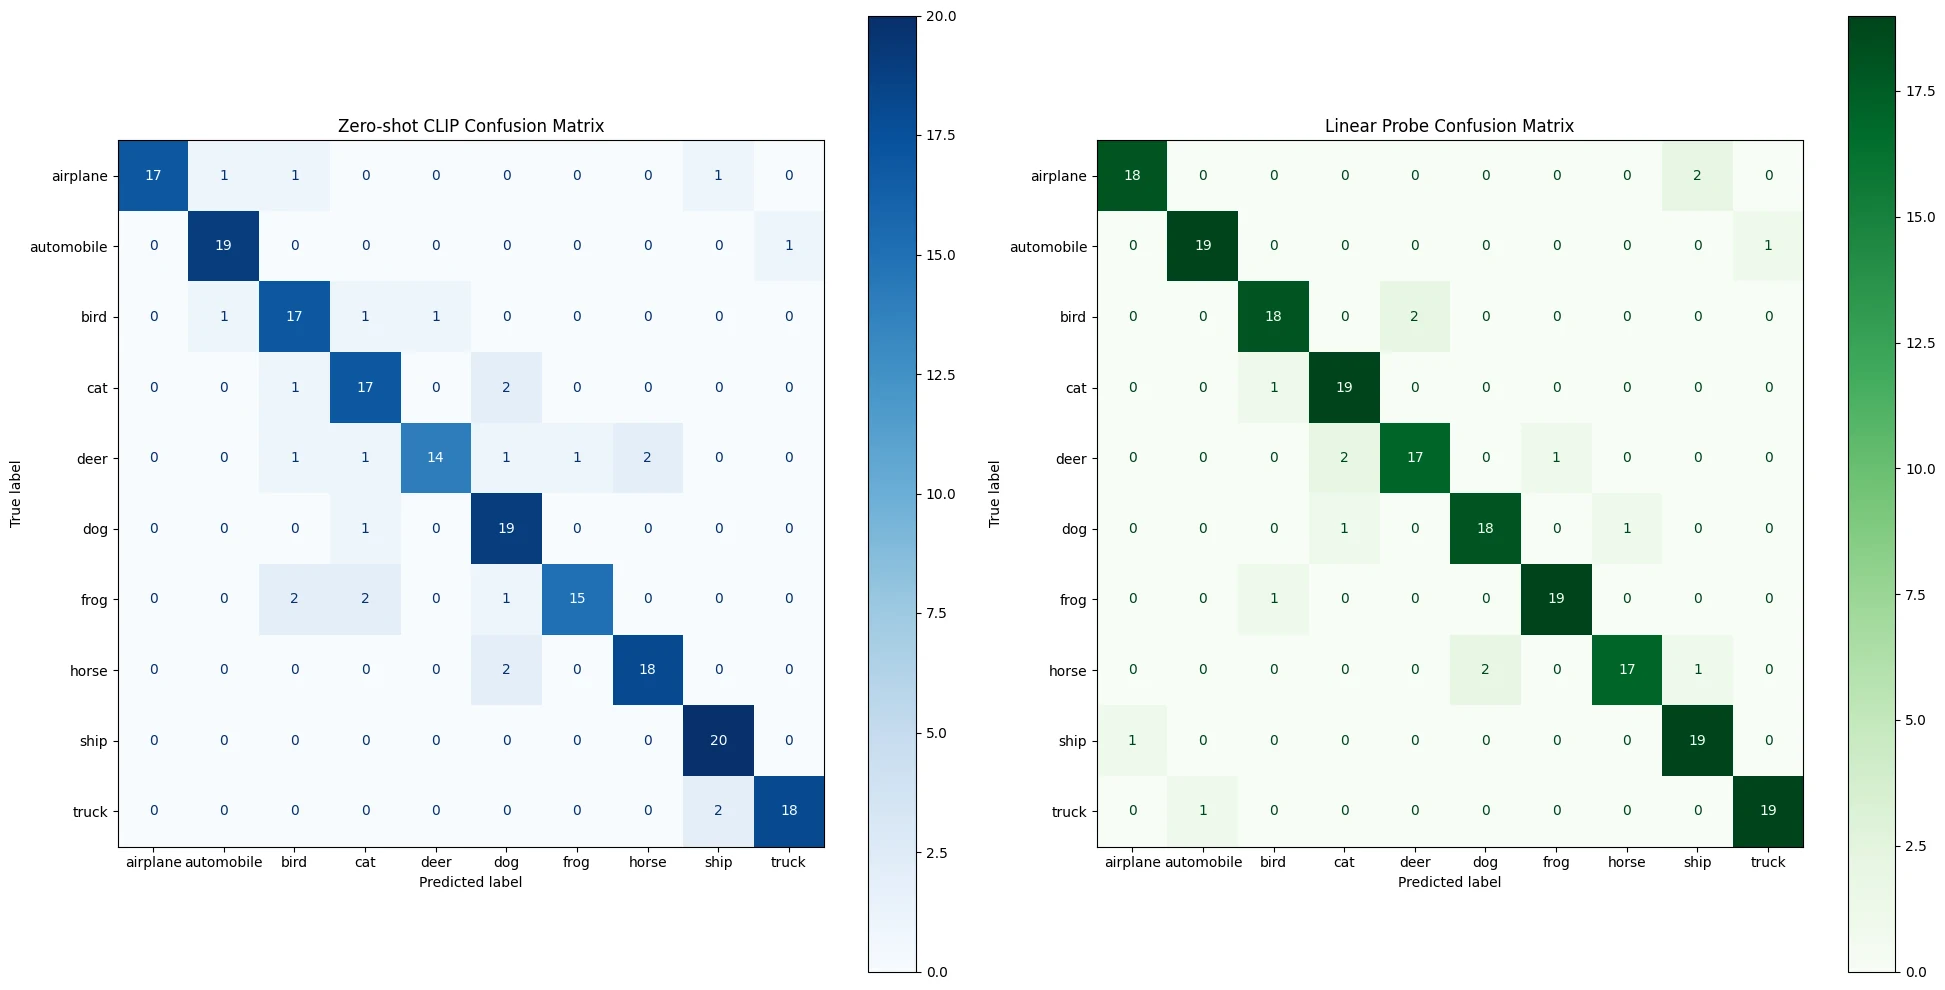
Zero-shot classification needs no labelled examples, only the class names. To see what it gives up, I trained a logistic-regression probe on the same frozen image embeddings: 80 images per class for training and 20 held out, and I scored both methods on those same 200 images.
Zero-shot CLIP and a linear probe on the same 200 images
| Method | Accuracy |
|---|---|
| 91.5% · 183 of 200 | |
| 87.0% · 174 of 200 |
The probe got nine more of the 200 right, gaining most on frog and deer, while zero-shot did slightly better on dog, horse and ship. Zero-shot's mistakes were also more scattered: its deer errors went to five different classes, the probe's to two.
The stored confusion matrices
A demo to try it by hand
I built a small Gradio app in the notebook so that anyone could test the model directly, using the same encoding functions as the experiment. It ran from Colab with a temporary public link and was never deployed.
- Image to text: score an uploaded image against your own comma-separated prompts.
- Text to image: return the closest image in the CIFAR-10 gallery.
- Zero-shot top five: the five most likely CIFAR-10 classes for an uploaded image.
- Ensemble comparison: the class each prompt set (A, B and C) picks for the same image.
Responsible use
CIFAR-10 contains no people, so the study itself raises few direct risks. The point of the report's governance section was what the behaviour means for real systems built on the same model.
- If wording shifts which classes succeed, prompts are part of the system and should be fixed, tested and versioned, not left to each user.
- Some classes are weaker whatever the wording, so a system needs to know where it is unreliable before it is trusted there.
- CLIP was trained on internet-scale data with undocumented biases; anything touching people needs its own evaluation and human review of uncertain results.
- I did not build any safeguards, such as uncertainty estimates or input checks. The report lists them as recommendations.
What I would change
- Replace hit-at-K with a metric that can move, such as precision at K or mean average precision over all 100 relevant images, and use many more queries than ten.
- Report differences as counts with uncertainty. A gap of 13 images in 1,000 needs repeated samples or a significance test before it means anything.
- Re-normalise each averaged prompt embedding. Without it, classes whose five prompts agree more closely get a slight edge when classifying, which could be as large as the differences I was measuring.
- Add prompts without the class name, to test whether the class word alone carries the result.
- Repeat on higher-resolution images, where the image side limits results less.
- Keep comparisons like for like: one notebook cell sets zero-shot accuracy on all 1,000 images beside the probe's score on 200. The fair comparison, on the same 200, is the one used here.
More about the evidence
- Every number here comes from outputs stored in the submitted notebook; nothing was re-run for this website. The copy on GitHub has the same cells and outputs; only Colab's widget metadata was removed so that GitHub can display it.
- Gallery: 100 images per class drawn from the CIFAR-10 test split with NumPy seed 0; one further image per class was set aside as a query image but not used by the retrieval metric.
- Top-5 classification accuracy was 99.3–99.5% under every condition, so the correct class was almost always among the five most similar.
- The report's AI-use statement records that ChatGPT helped with parts of the code, debugging and the report's structure; the experimental choices and interpretation were mine.